Bitcoin Trend Analysis: Past Cycles’ Percent Gains
I made this chart months ago. As with most of my life, I knew what to do, but didn’t do it very well. See that big, thick red line near $60k? That’s the lowest profit target for this model* and I planned to take profits there. I did not. I did handle this dip better than past dips, though, which is a small consolation of growth & progress. (When I despair at how stupid I am, I remember that I am slowly learning and improving.)
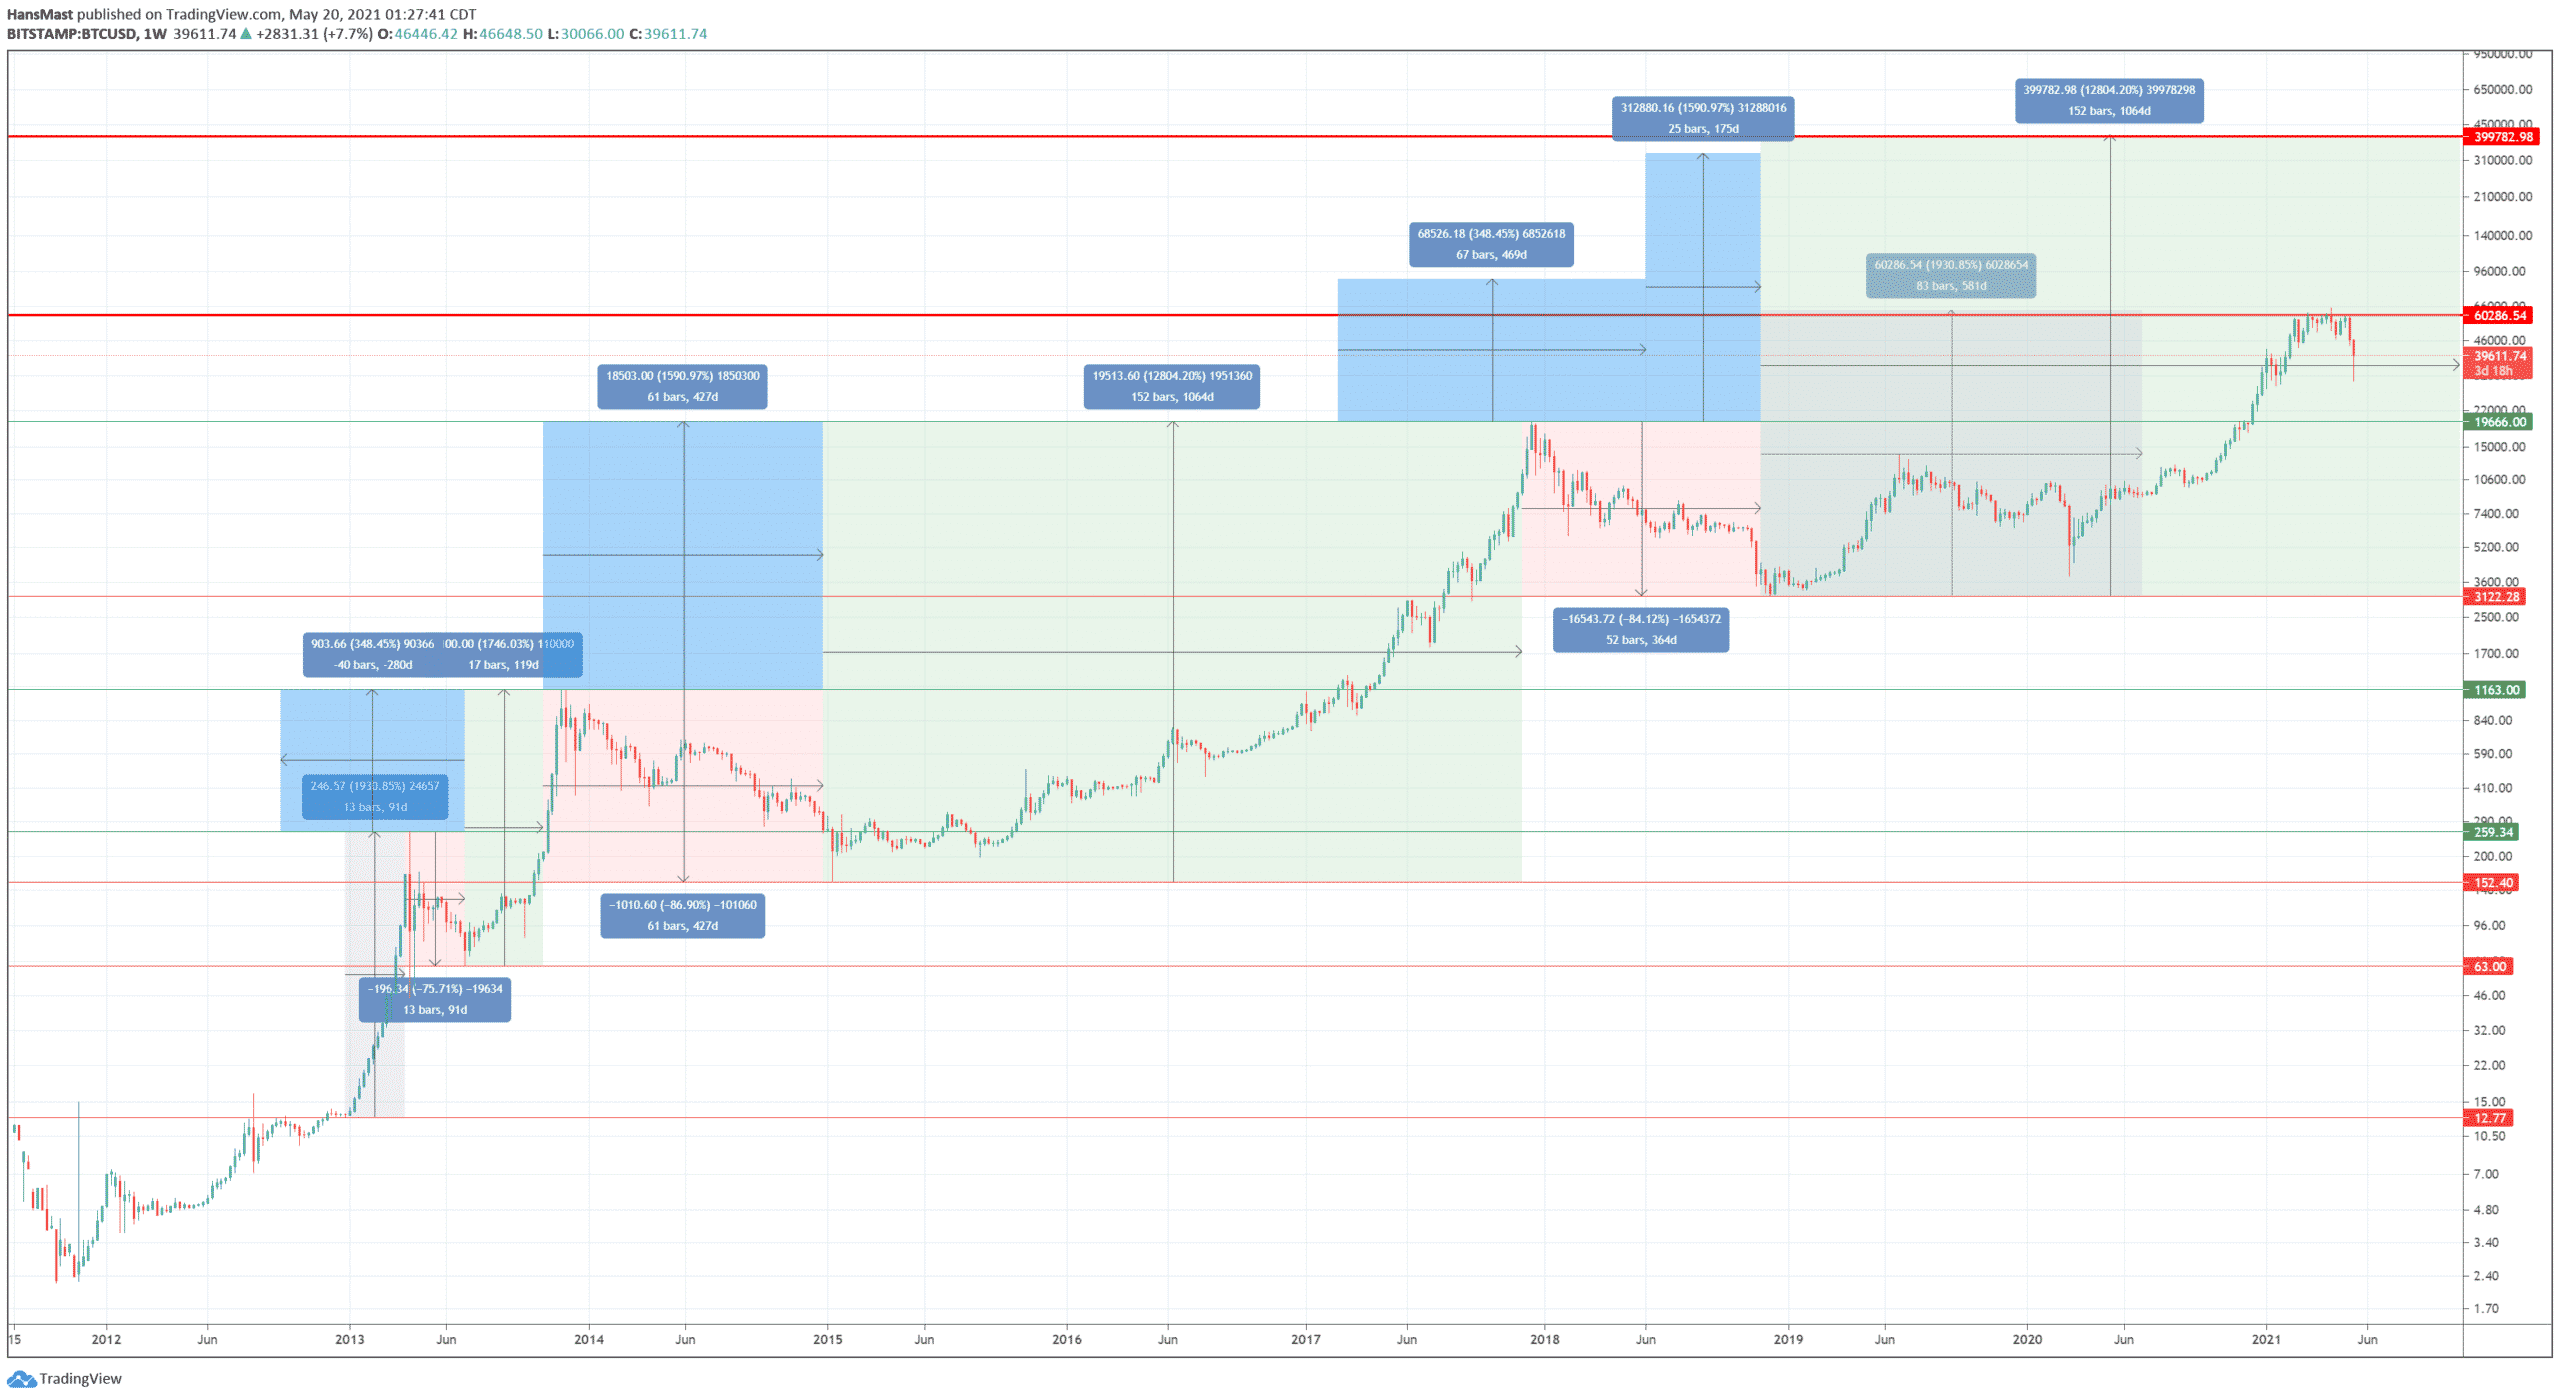
The basic idea for this historical price analysis was to look at the past bull and bear runs of BTC, and look at two attributes of each cycle:
- Percent gain or loss
- Percent gain previous peak to new peak
- Percent gain previous trough to new peak
- Percent loss peak to trough
- Number of days/bars for each move
This post analyzes only the two kinds of percent gain. (I may update this post in the future with the number of days/bars for each move and percent loss peak to trough.)
Here are the numbers in a Google Sheet for easier analysis (the numbers on the graphical chart above are hard to read in places):
(*Now that I systematically put this in a spreadsheet, I see that on my chart a few months ago, I missed the very lowest target of $57,638.23 which is the 2013 Trough-Peak run of 1,746.03%.)
From this analysis, we have basically three possible targets from this model:
- $57,638.23 to $63,408.82 (2012-2013 & 2013 Trough-Peak)
- $88,192.18 (2013 Peak-Peak)
- $332,546.16 to $402,905.26 (2013/2015-2017 Peak-Peak & Trough-Peak)
(Yes, I know $400k and $332k are $70k apart, but that’s only 21% and this is a %-based analysis.)
So there you have it! Past performance is guarantee of future results! (Sarcasm alert.)
My favorite catchphrase when it comes to this kind of analysis is that “History doesn’t repeat, but it does rhyme.”
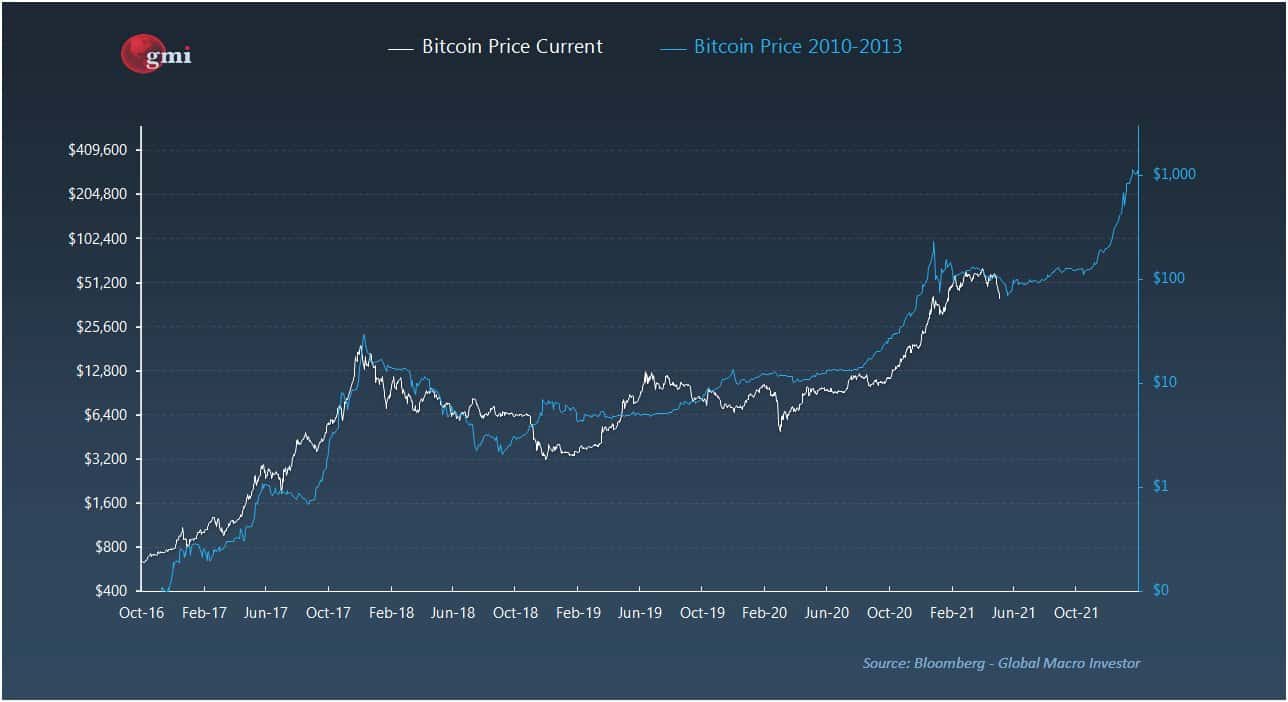
I’d like to finish with two gorgeous charts from the amazing Raoul Pal who is GMI: